It matters little if the stock market has been in a strong “bull market” like we have experienced in the past 9 years, or if the stock market has been cut in half, like in 2009, you will still find handfuls of articles and headlines proclaiming a pending stock market crash because the market is too expensive. I can’t promise you the market will go up or down over the next 5 years, but I can promise you that “TV experts” will continue to proclaim they know. All they really seem to know is that a broken clock is still right twice a day.
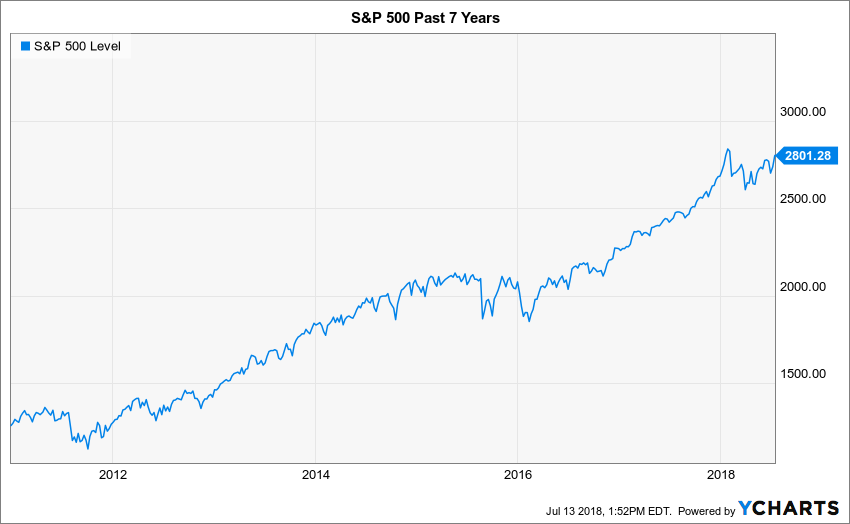
In 2011 one of the largest asset management firms, GMO, stated that the S&P was worth no more than 950. They also stated that “risk avoidance looks like a good idea” and that their 7 year projection for large cap U.S. stocks was just 2.7% per year.(1) Of course, 7 years later the S&P is closing in on 2800, a far stretch from the 950 valuation it was given at the time. Imagine taking that advice in 2011?
There are a lot of very smart people working for firms like GMO and that should tell us one thing. History continues to repeat itself by proving to be completely unpredictable. Timing the market is hard, if not impossible. The best investors in the world have all made mistakes and taken significant losses at some point in their careers. So why exactly is the market so hard to time? One reason is that the market is very difficult to value.
Current market valuation may be a primary influence of future returns. The price of a stock market index is only one component of it’s actual valuation. Professionals and academics alike argue about what the other variable should be, but the most common and easiest to use is earnings per share.
Investors want to know how much the 500 companies in the S&P 500 actually earn in profits compared to the stock prices they pay for those companies. This is commonly known as the Price-to-Earnings ratio or P/E. If a stock or index cost $100 and the earnings per share is $2, the P/E is 50.
Whether a 50 P/E is considered an expensive, fair or cheap valuation depends on relative statistics, such as the historical P/E, the expected future growth of earnings and the average P/E of the investment’s peers, like their sector or industry. For example, if a stock has a P/E of 50 with a 5-year average P/E of 80 and the industry average is 70, it may be considered cheap because it’s less than both of those comparable values. Of course, only time will tell if it’s truly cheap.
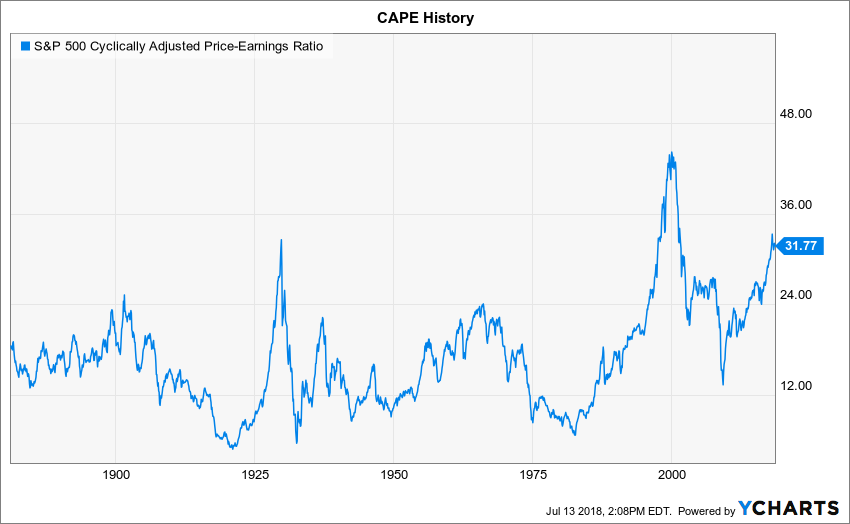
How do we apply a valuation to an index or to the stock market using the P/E of all the stocks? A commonly used measurement for the S&P 500 is the Schiller Cyclically Adjusted P/E ratio, or CAPE.
The CAPE ratio is an alternative version of the P/E ratio for the S&P. Instead of taking the current earnings to calculate the P/E, the CAPE uses an inflation-adjusted average of earnings from the past 10 years. It essentially smooths out the variability of reported earnings over a period of time instead of taking the most recent earnings on it’s own. The S&P’s CAPE long-term average is 16.80.
The current CAPE level is almost twice the average, sitting at 31.77. It has only been over 30 two other times in stock market history, in 1929 and 2000.
The market can’t be timed, but by most metrics the 2018 stock market is expensive when stood up against historical prices. With that being said; the infamous CAPE ratio is flawed enough that it can’t be relied on to try and time the market. Here are a couple reasons why:
- The CAPE ratio is backwards looking, ignoring future growth of earnings.
- GAAP changes have changed how companies report earnings making historical comparisons less reliable.
- The 10 year earnings is considered to be understated because 2008 – 2010 earnings were very low.
If earnings increase at record rates over the next couple years and 2008 – 2010 are no longer included in the 10-year average, the 10-year earnings will increase which means the CAPE ratio will decrease without the prices of stocks actually having to decrease, making the valuation seem more reasonable. The research I’ve done, however, indicates that the ratio won’t fall below 27 without stock prices dropping unless future earnings continue to grow by more than expected.
So, is the market expensive? Historically speaking, yes. Can we rely on this data to try and time the market? That’s probably not wise. Attempt this at your own peril.
What if anything can we really take away from this data? For starters, it may be prudent to make more conservative return assumptions over the next 5 to 10 years in your portfolio.
At Arbor it changes the way we evaluate and manage risk. It impacts financial and tax planning. We believe our clients can enjoy high expectations without having to worry about market timing. We accomplish this with custom investment plans that use a combination of traditional and alternative strategies to reduce tail-risk in portfolios, manage sequence of return risk and still grow portfolios while hedging against future tax increases.