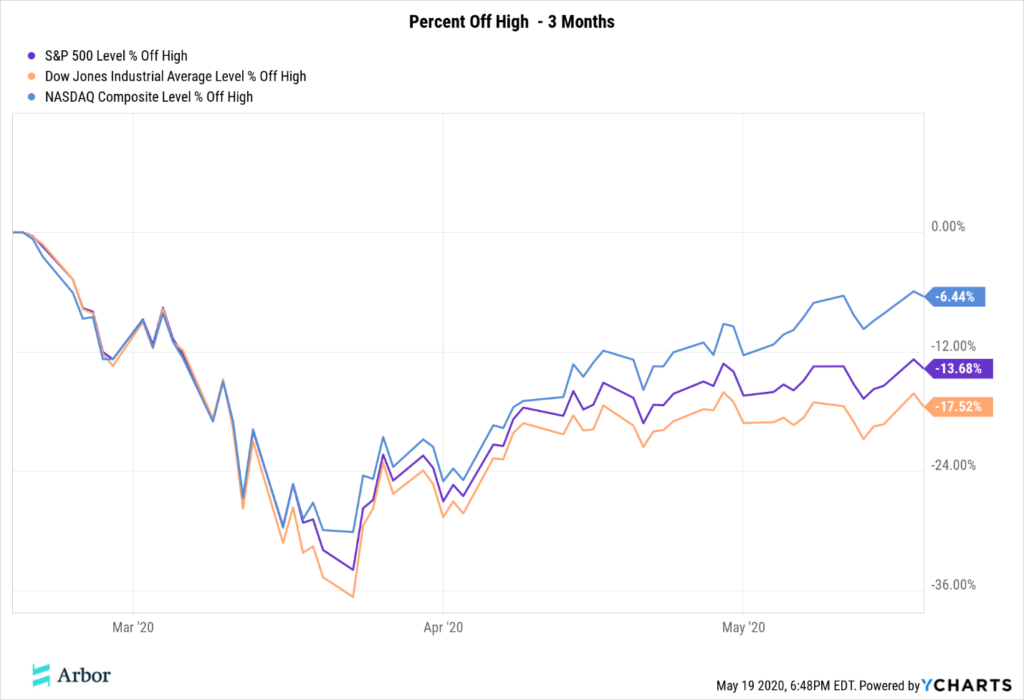
We are 3 months removed from the start of a major pullback in the stock market due to COVID-19. March, 2020 saw one of the fastest and scariest draw-downs in stock market history. Let’s start by visualizing the velocity of the drop.
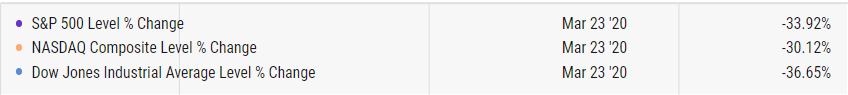
On the day considered “the bottom”, March 23rd, these were the percentages off of the high for the 3 major indexes. You can visualize this below, while seeing that as of today, much of the losses have been recovered.
The landscape of the bond market has also changed, with treasury yields dropping dramatically. Financial professionals are no longer looking at bonds as an income generating asset class, but more as a hedge against market volatility. Today, the 10 Year Treasury Rate is at .70% and the 30 Year Rate is at 1.44%. These rates are considered the benchmark for risk-free returns to compare other returns against. The lower these rates are, the more risk you have to take to achieve a desired return above these rates.
So what does that mean for your portfolio? Properly diversified portfolios will blend equity vs. bond investments in a manner that matches your risk tolerance. Here is a look at the benchmarks we use against our portfolios, and how they have performed in the past 3 months.
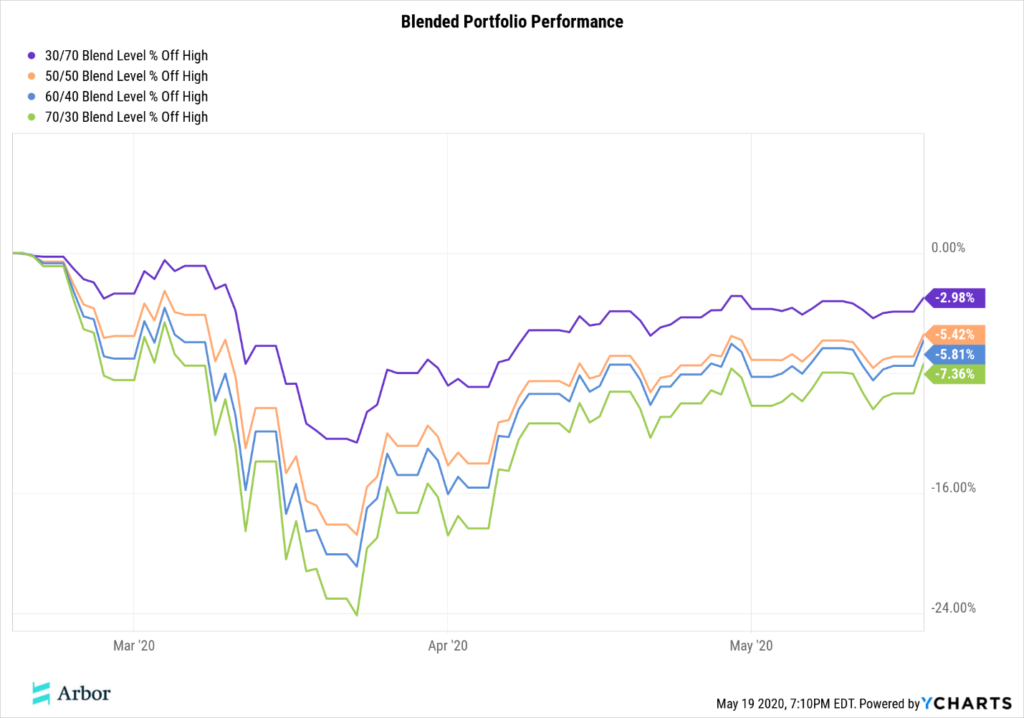
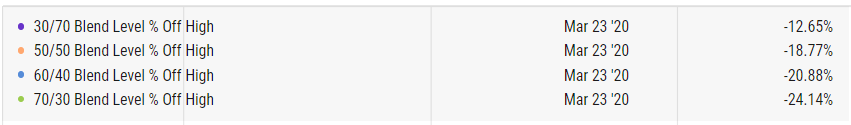
As of today, they have recovered most of their losses. On the worst day, March 23rd, the blended portoflio returns looked like this.
A side-by-side analysis with the market index returns displayed in the beginning shows that these blended portfolios have done their job with more manageable draw-downs in value for an investor who is looking for less risk.
These are good benchmarks to compare your personal portfolio returns against. Did you lose more or less than you would have expected?
At Arbor we constantly monitor portfolio drawdowns, but to analyze our client’s performance we must also consider any annuities being used as alternative assets. You should do the same with any alternative assets you have.
We use annuities strictly for potential asset appreciation, not for income. We believe if used correctly, we can limit a portfolios downside risk while maintaining much of the upside potential.
Please visit Modern Annuity Planning if you would like a more thorough explanation of how this works.
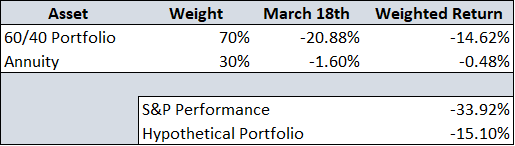
So what does a hypothetical portfolio built the Arbor way look like when the stock market is down 35% in 1 month? We will build a fictional client starting with $1,000,000 in investment assets. Their risk tolerance and financial plan calls for a 60/40 portfolio applied to 70% of assets, or $700,000. The other $300,000 will be used to buy an annuity that has no downside risk for the initial premium, but credits 40% of the S&P 500 price returns in interest on an annual basis. No hidden fees or tricks. It is as straight forward as that.
To be fair in the analysis, let’s assume the annuity had $5,000 in gain that was not yet locked in at the annual anniversary, so the value was $305,000 at the start of the market crisis. If the annuity drops from $305,000 to it’s lowest allowable value of $300,000, that’s a 1.6% loss we need to factor in.
Monitoring and evaluating your portfolio draw-downs is important. The trick is to make sure your downside risk is within the tolerance that your financial plan has established so you can reasonably ensure you won’t run out of money during retirement, while still realizing market growth and not being falling behind because of inflation, inefficient income taxation, or high fees. For more on our investment philosophy, please visit this page.